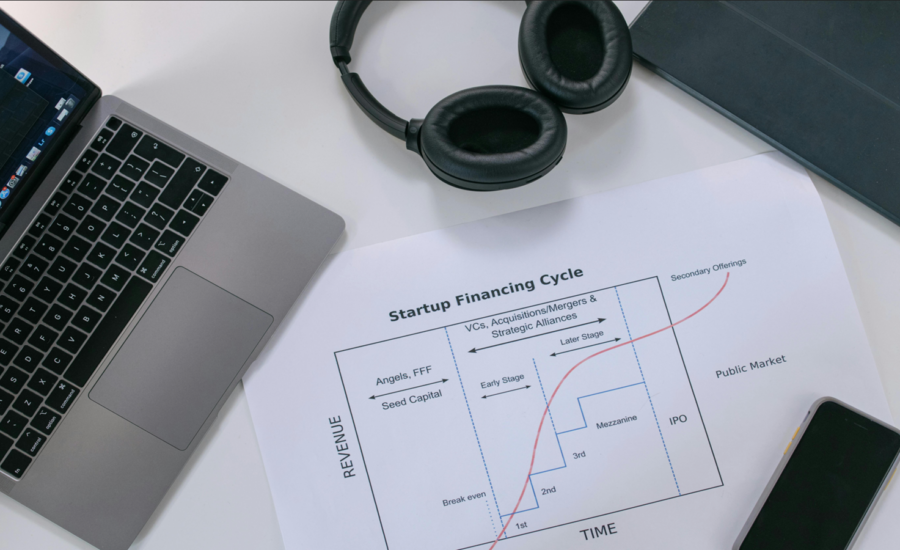
When investing in IPO stocks, new issues don't play by the usual rules. Companies making initial public offerings draw a lot of investor attention. That often results in unusual and brand-new chart patterns. Volatility can rise as
Chart Lesson
- Home
- Chart Lesson
Let's say you've become great at spotting the cup and handle pattern and getting comfortable with the flat base and double bottom. Way to go. Those common base patterns, seen among the biggest stock market winners, are likely to be
The Harami Candlestick Pattern is a Japanese candlestick pattern that can be used in technical analysis to identify potential trend reversals. The harami pattern is made up of two candlesticks, with the first being larger and the
The Abandoned Baby candlestick pattern can be found in the charts of Stocks, Commodities, Futures, Exchange Traded Funds (ETFs) like the SPY or QQQ, and Forex. The Abandoned baby can be a bullish or bearish pattern that
Stocks, Commodities, Futures, and Exchange Traded Funds (ETFs) like the SPY or QQQ will often break out of a cup and handle or double bottom pattern, run-up at least 20%, and then trade essentially sideways to form
Stocks, Commodities, Futures, and Exchange Traded Funds (ETFs) like the SPY or QQQ will often break out of a triangle pattern and potentially have a nice run-up or down. This pattern can be traded as a day
The Doji candlestick pattern can be found on the charts of Stocks, Commodities, Futures, Exchange Traded Funds (ETFs) like the SPY or QQQ, and Forex. It is a neutral candle but can be bullish or bearish when
There are two types of Double Bottoms: the standard one and the William O’Neil one. We will explore the latter in this lesson. The Double Bottom is a bullish pattern that gives us a buy alert. This


